|
This assignment is meant to help you better understand the role of free parameters in the Galaxy Luminosity Function. Generate three separate plots for the questions below. The plots should have log(L) on the X-axis and log (Phi) on the Y-axis.
(1) For Phi* = 0.015 h^3 Mpc^-3, M* - 5 log(h) = -20.5, and faint end slopes of -0.5, -1.0, -1.5. You have to make all three LF plots on the same graph. (2) For Phi* = 0.015 h^3 Mpc^-3, faint end slope of -1.0, and M* - 5 log(h) = -18.5, -20.5, -22.5. You have to make all three LF plots on the same graph. (3) Faint end slope of -1.0, M* - 5 log(h) = -20.5, and Phi* = 0.045, 0.015, 0.005 h^3 Mpc^-3. You have to make all three LF plots on the same graph. Your report should include a discussion on what you infer from the plots.
0 Comments
This assignment involves some analysis on the galaxy cluster Abell 2255. An SDSS image of the cluster is shown below. The cluster core has coordinates of RA = 258.1292 deg, Dec = 64.0925 deg. 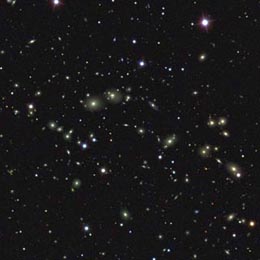 The data on member galaxies of the cluster can be downloaded from here : ABELL2255
The separate columns (comma separated values) in the data file are as follows:
In this assignment you will do morphological classification of galaxies by eye. Though there are many automated classification routines available, the human eye is still reliable for pattern recognition.
Download the instructions from here: Galaxy Morphology Classification This additional material is required to complete the assignment : Galaxy Colors Data Read the articles posted in the Readings section on Low Surface Brightness galaxies and Dwarf galaxies. We will discuss briefly both these articles in class.
Read the article "Formation and Evolution of the Milky Way" by Cristina Chiappini. Come prepared to class to discuss this paper.
Draw a map with Galactic coordinates (Hammer-Aitoff projection) and plot the distribution of Galactic globular clusters in it. Each globular cluster's location should be marked with a reasonably big filled circle. The plot should also have the location of the Sun clearly marked. From the observed distribution what all can you infer?
Milky Way Globular Cluster Catalog: Download Also read the Encyclopedia of A & A article on Globular Clusters. Come prepared to class to discuss this paper. The assignment is split into two parts :
(1) Create a Hammer - Aitoff grid system suitable for plotting the position of objects in Galactic coordinates. You can refer to this write-up for help on how to create such a grid system. Hint: One approach to create the grid system is to draw lines of constant Gal. latitude (for different Gal. longitudes between -180 and +180 deg), followed by drawing lines of constant Gal. longitude (for Gal. latitudes between -90 and +90 deg). (2) Plot the position of point sources from the 2 micron all sky survey (2MASS) catalog. Instructions for downloading the 2MASS point source catalog is given below. Once you have the catalog, plot the location of the point sources in Galactic coordinates (in the Aitoff plot). Based on this exercise, come prepared to answer the following questions: (a) What could be these "point sources" in the 2MASS catalogue? (b) What can you infer by looking at their distribution in the Galaxy? For downloading the 2MASS Point Source Catalog (PSC), follow these steps
In class I showed a figure of the distances to molecular cloud complexes to indicate the spiral structure within the disk. The figure was from Dame et al. 1986, ApJ. Go through the paper and figure out how the distances to the cloud complexes were estimated?
Model the continuum emission from stars of spectral type O to M.
Produce plots of log (intensity) vs. log (wavelength), or frequency or photon energies Find out stars of which spectral type(s) are capable to producing a H II region. (A) Read the following sections from the article X-Ray Studies of Supernovae and Supernova Remnants (see Readings link). Come prepared to answer questions based on the reading. Sec 17.1.1, Sec 17.2.4.1, Sec 17.2.4.2, (B) Radiation from SNR at X-ray wavelengths includes both thermal bremsstrahlung and line emission. The continuum at X-ray wavelengths is thermal bremsstrahlung. Find answers to the following : (a) What is the difference between thermal and non-thermal bremsstrahlung radiation? (b) What properties of the gas does the specific intensity (I_nu) of thermal bremmstrahlung radiation depend on? (c) What is the formalism for specific intensity of thermal bremmstrahlung? (d) How would plots of log (specific intensity) vs. log (nu) look for two different temperature T_1 and T_2, where T_1 > T_2? |
AuthorWrite something about yourself. No need to be fancy, just an overview. Archives
March 2017
Categories |
 RSS Feed
